Sukatan Serakan
What you need to learn in this topic
- Menentukan julat, julat antara kuartil, varians dan sisihan piawai sebagai sukatan untuk menghuraikan serakan bagi data tak terkumpul.
- Menerangkan kelebihan dan kekurangan pelbagai sukatan serakan untuk menghuraikan data tak terkumpul.
- Membina dan mentafsir plot kotak bagi suatu set data tak terkumpul.
- Menentukan kesan perubahan data terhadap serakan berdasarkan: (i) Nilai sukatan serakan (ii) Perwakilan grafik
- Membanding dan mentafsir dua atau lebih set data tak terkumpul, berdasarkan sukatan serakan yang sesuai dan seterusnya membuat kesimpulan.
- Menyelesaikan masalah yang melibatkan sukatan serakan.
Quick Notes
Live Tuition Recordings

CHAPTER 8: MEASURE OF DISPERSION OF UNGROUPED DATA (PART 3)
Tutor: Miss Jannah
Thursday
12 Sep 2024
09:00 pm
CHAPTER 8: MEASURE OF DISPERSION OF UNGROUPED DATA (PART 2)
Tutor: Miss Jannah
Thursday
05 Sep 2024
09:00 pm
CHAPTER 8: MEASURE OF DISPERSION OF UNGROUPED DATA (PART 1)
Tutor: Miss Jannah
Thursday
29 Aug 2024
09:00 pm

Sukatan Serakan Data Tak Terkumpul (Varians & Sisihan Piawai)
Tutor: Cikgu Maria
Tuesday
27 Sep 2022
08:00 pm
Experiments
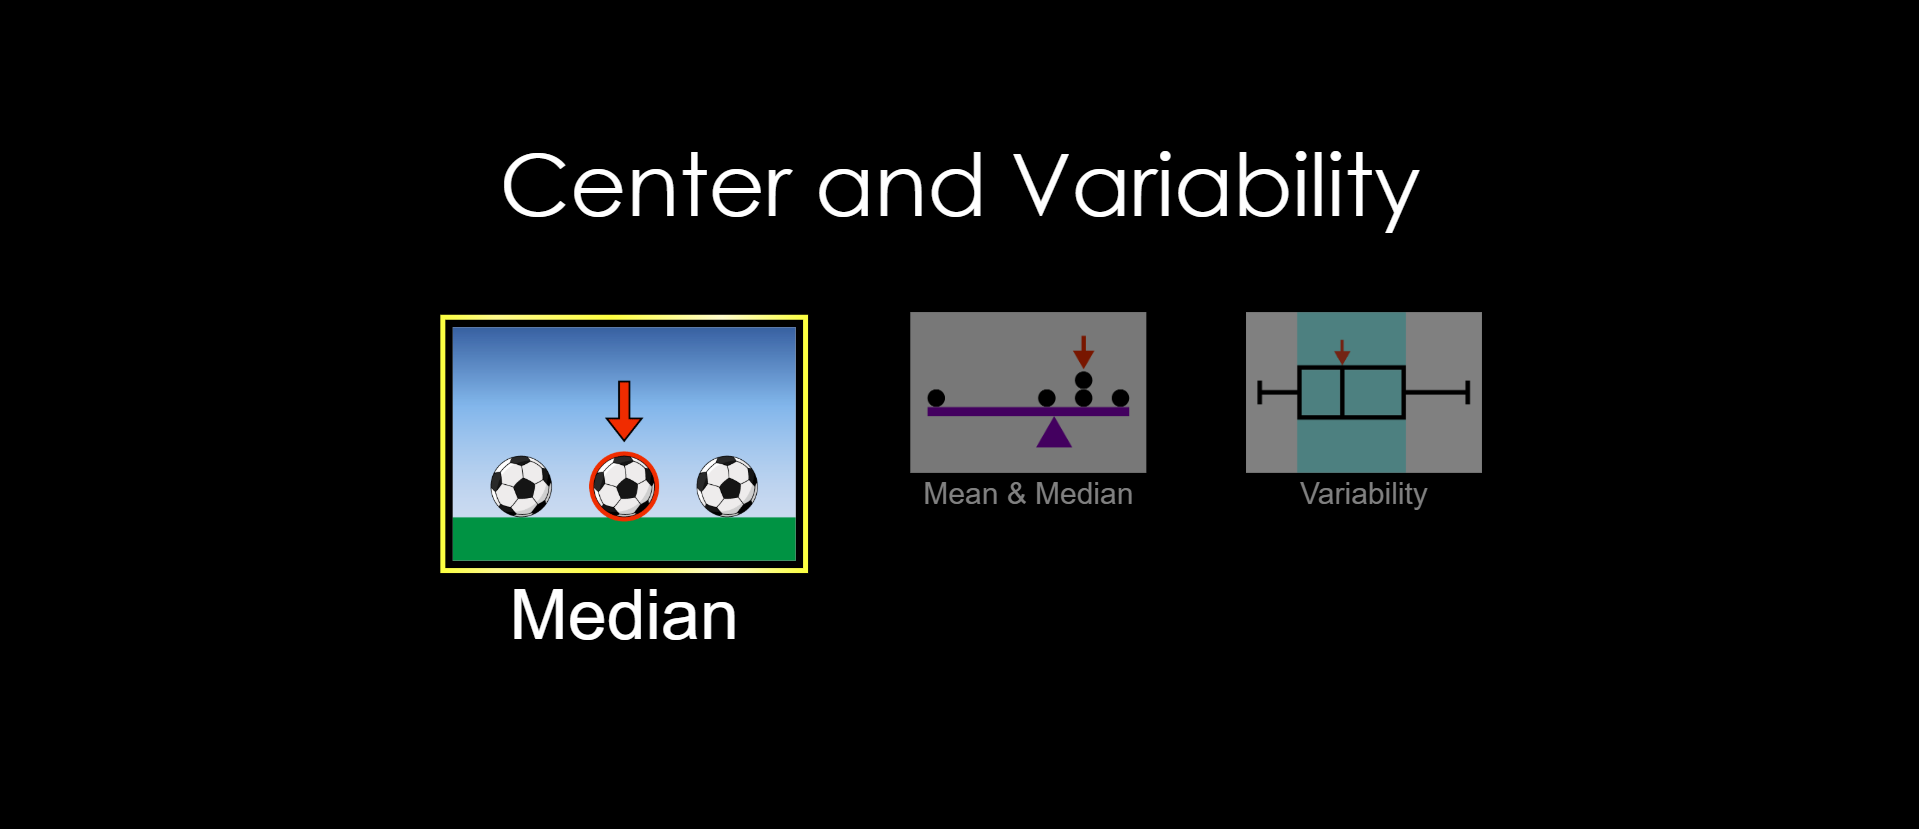
Pusat dan Kebolehubahan
Malay
English


Tebus eVoucher
Tebus ganjaran untuk meghargai kerja keras anda
Learn more »Practices for this topic
-
Flashcard
- Sukatan Serakan